Welcome to Expression Atlas help
Browse experiments in Expression Atlas
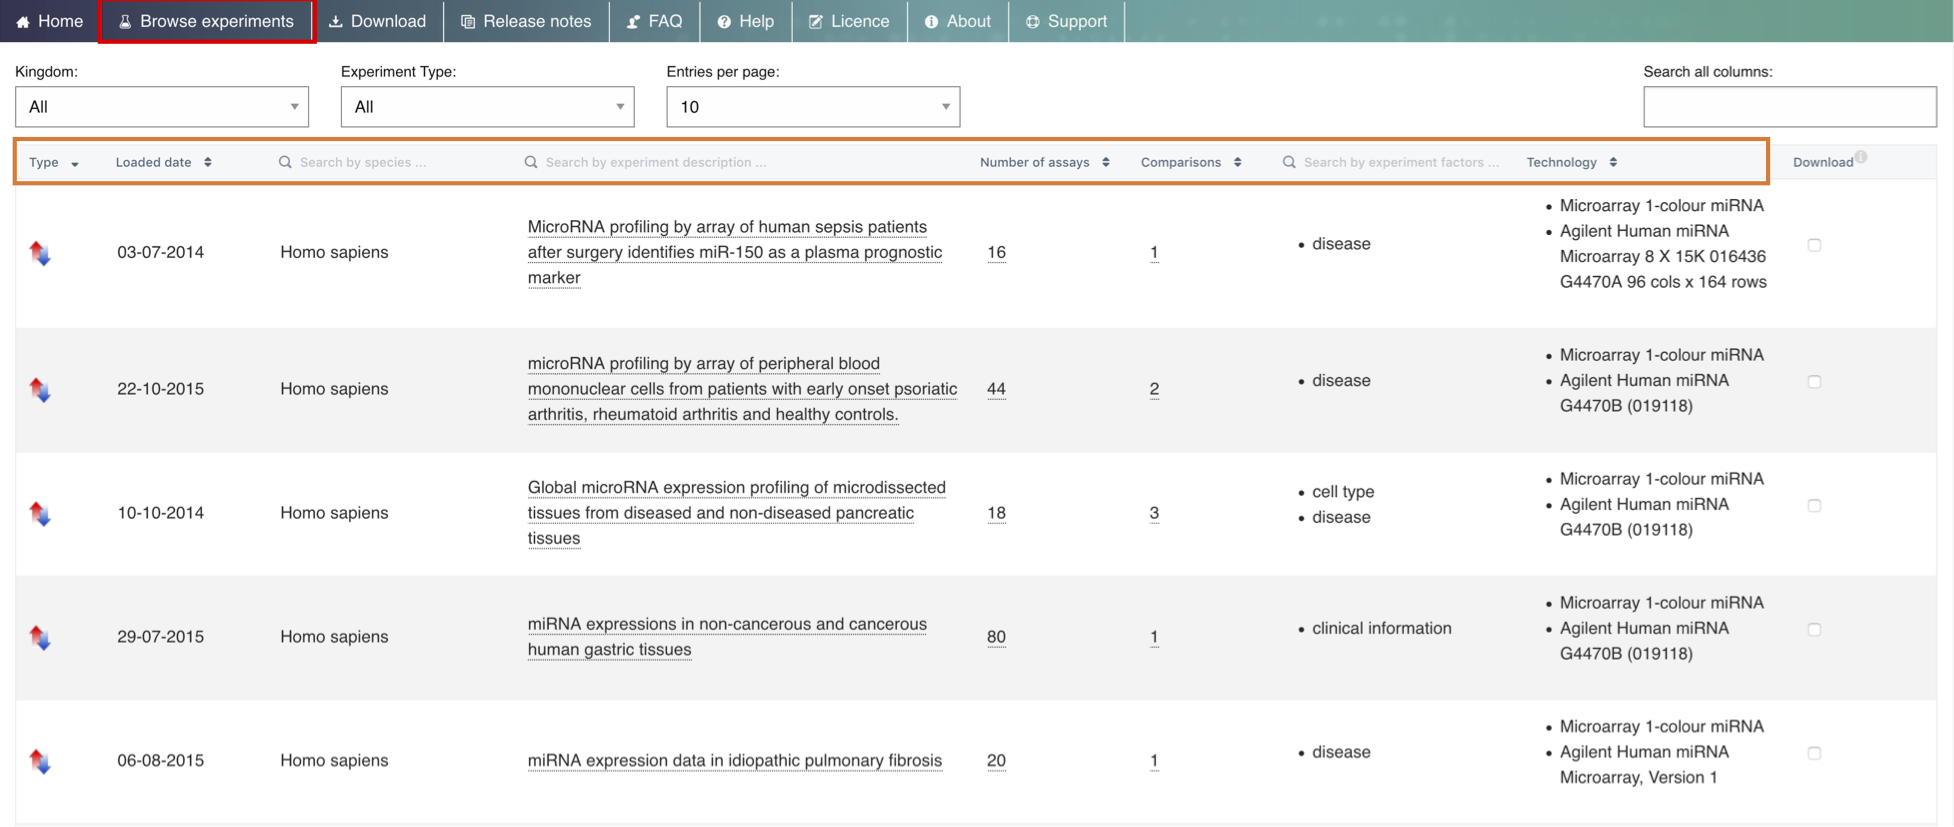
You can browse through the experiments in Expression Atlas in the Browse experiments tab, which shows you a table listing all the experiments currently available in Expression Atlas. You can filter and/or re-order the table content using the categories and search boxes in the header line.
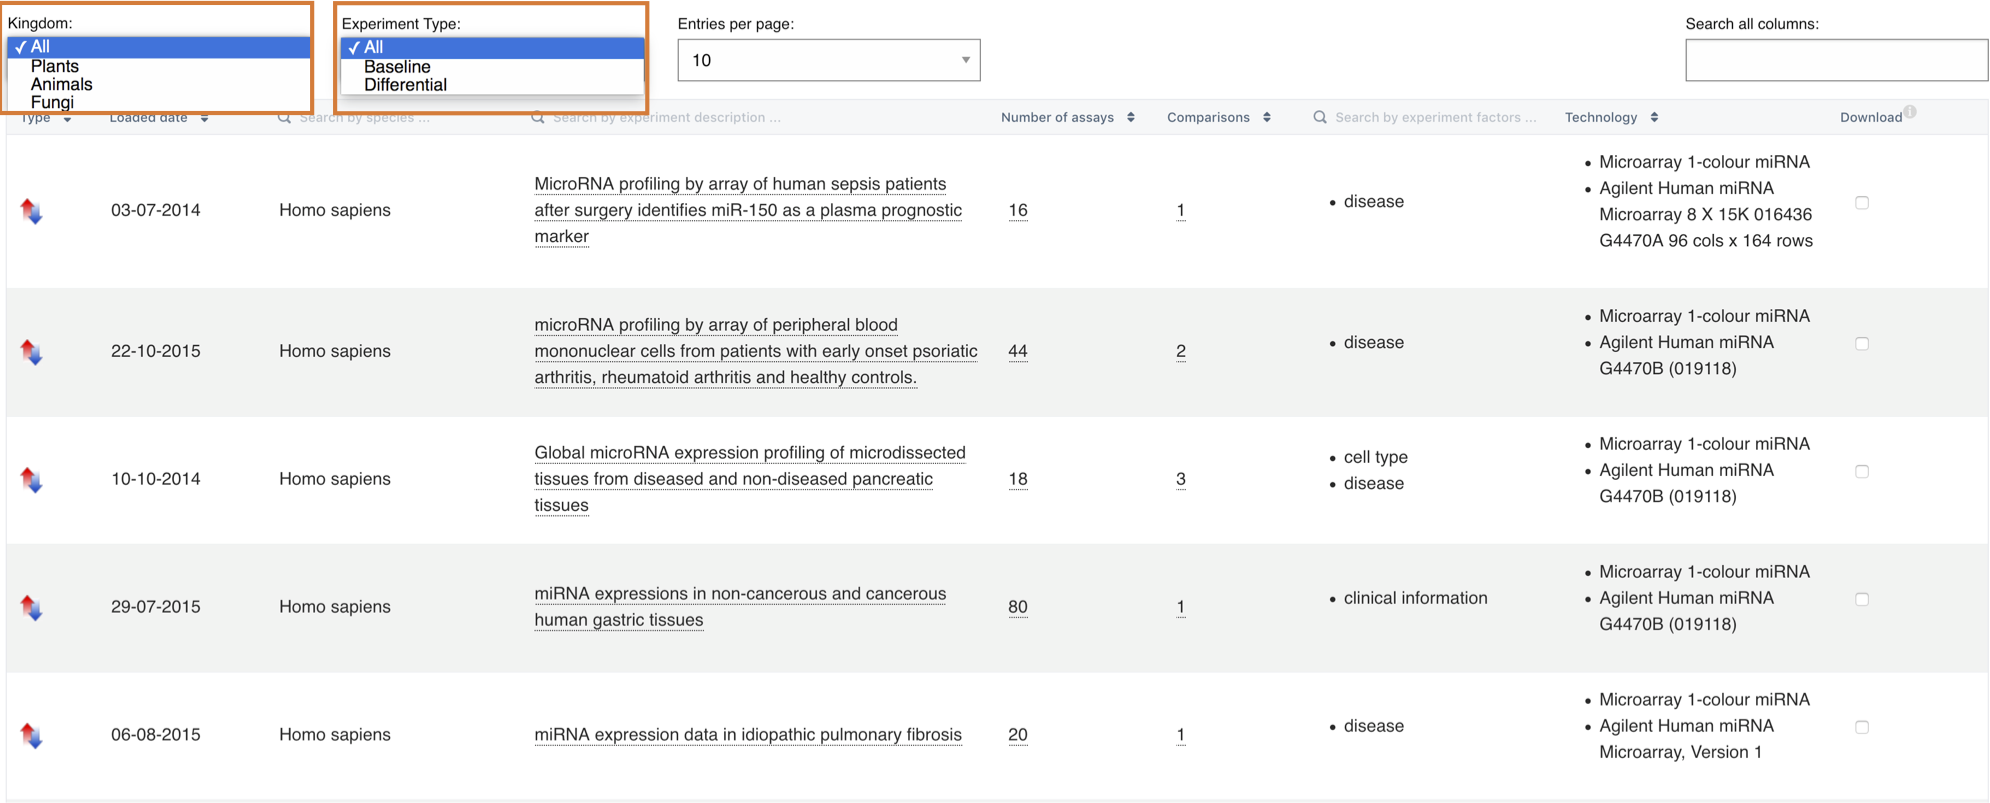
You can also filter the table content using the two boxes above the table - the Kingdom and the Experiment Type filter boxes, which allow you to narrow down the results according to your taxon of interest and/or experiment type (baseline vs differential).
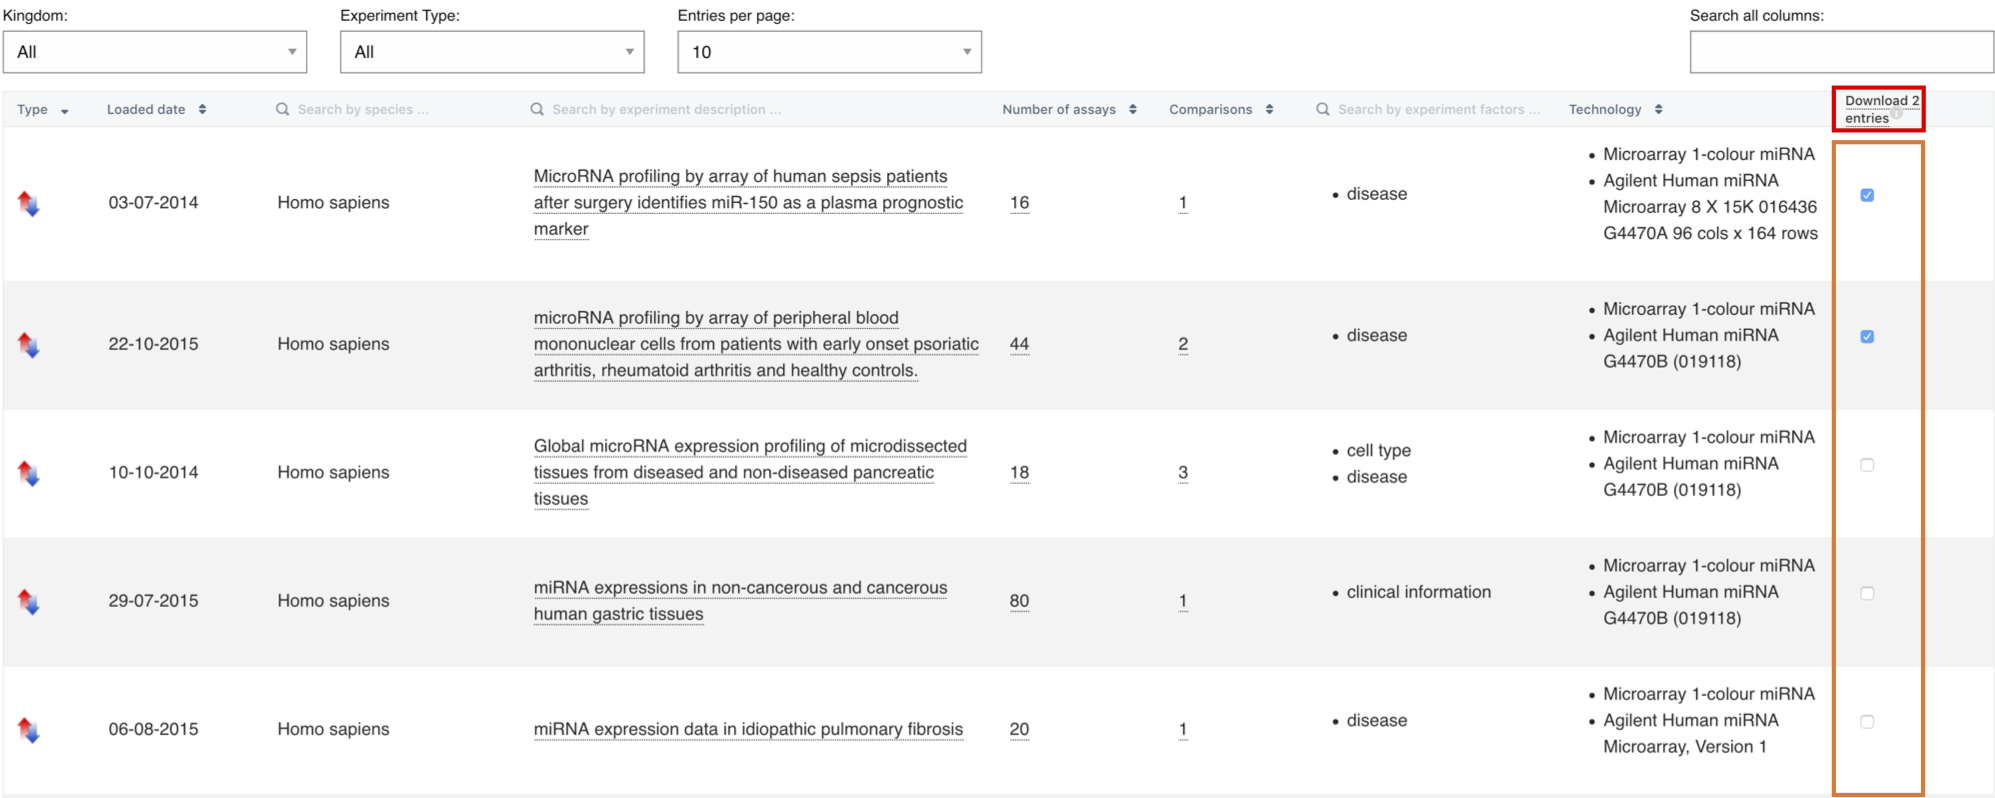
Finally, you can directly download the gene expression data and the experiment metadata as a zip file by selecting one or more experiments in the table and clicking the Download entry link in the table header.
How to search in Expression Atlas
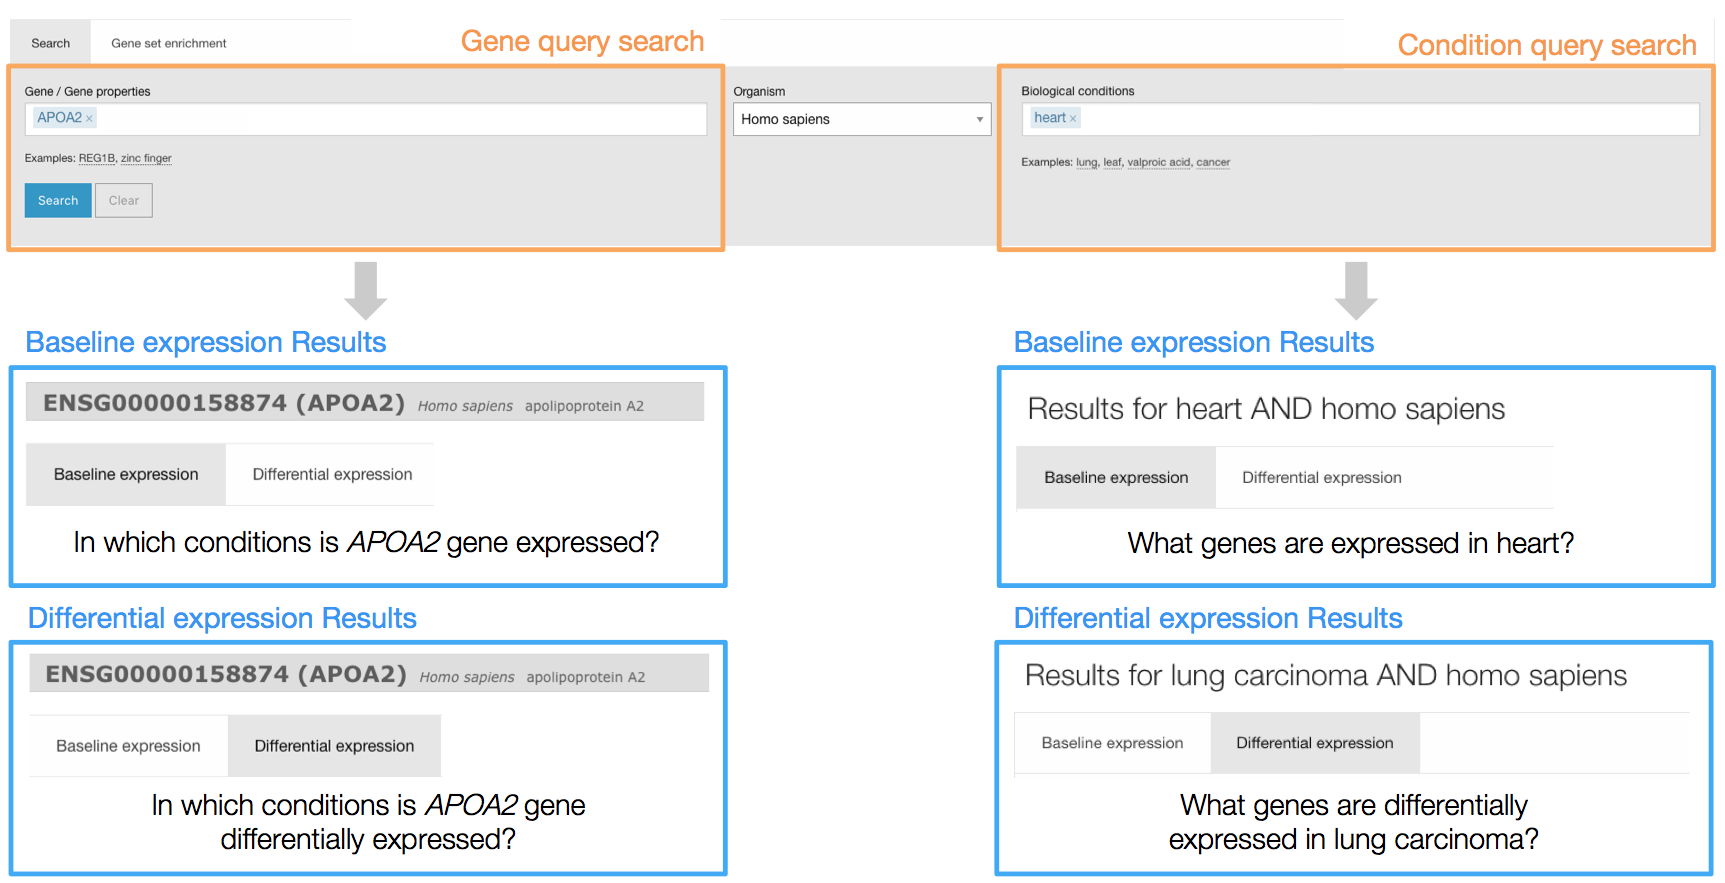
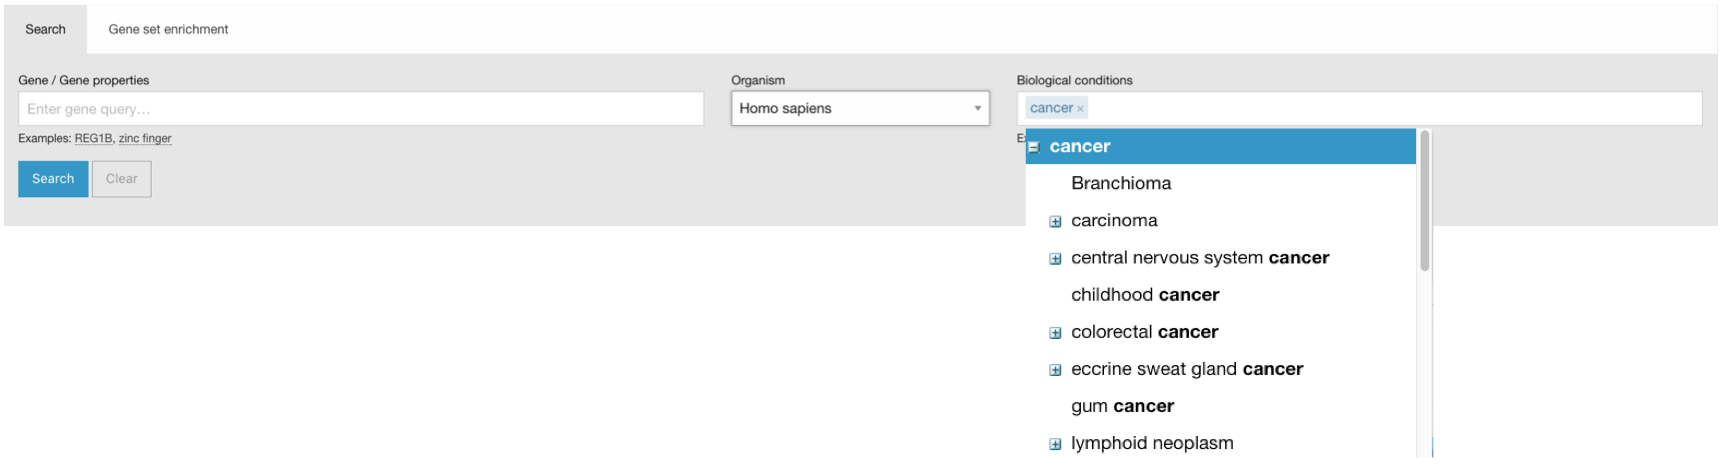
In Expression Atlas you can either search by gene (e.g. APOA2) or by biological condition (e.g. heart or lung carcinoma). Use the Gene query search box to find out in which conditions is APOA2 gene expressed (baseline results) and in which conditions is APOA2 gene differentially expressed (differential results).
Use the Condition query search box to find out what genes are expressed in that particular condition, e.g. heart (baseline results) or to find out what genes are differentially expressed in the condition you searched for, e.g. lung carcinoma (differential results).
Ontology-driven query expansion
Your queries are expanded using the Experimental Factor Ontology (EFO). This means that if you search for e.g. “cancer”, you will also see results with terms such as “carcinoma” and other terms that are children of the cancer entry in EFO.
Baseline expression results
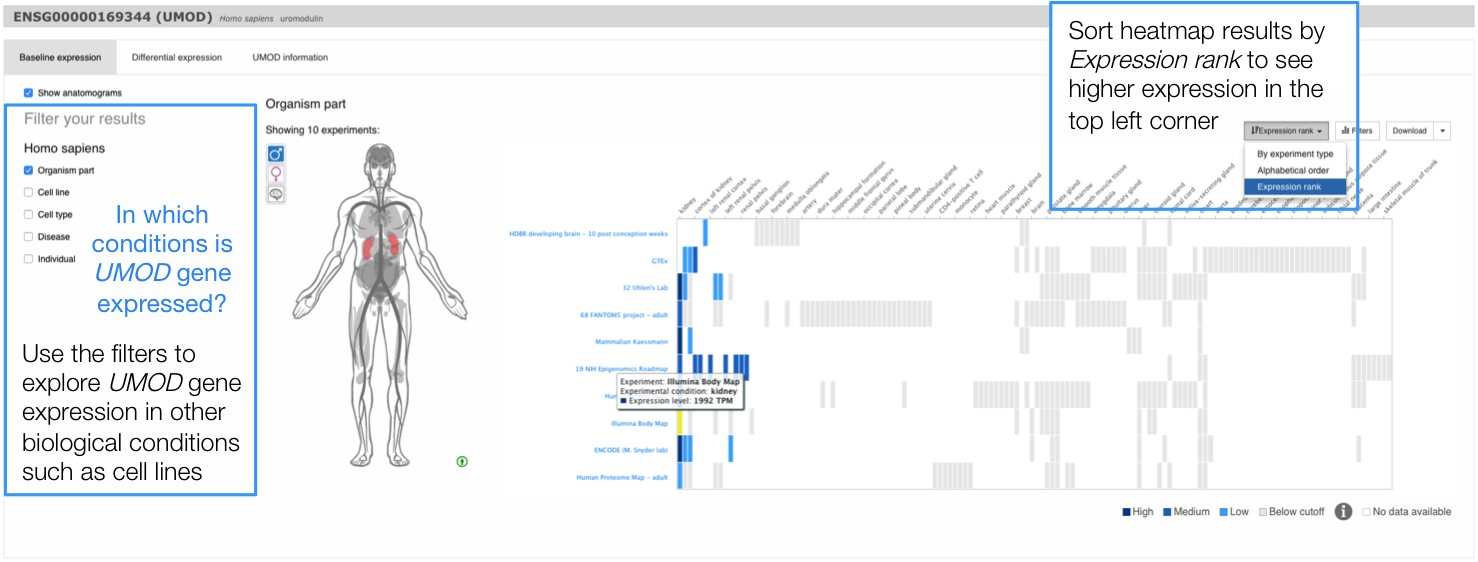
When you search for a particular gene (e.g. UMOD) in one species (e.g. Homo sapiens), the Baseline expression results will show a heatmap with all tissues studied (columns) in different experiments (rows) in which UMOD gene is expressed above the default minimum expression level of 0.5 FPKM or 0.5 TPM.
Expression levels are displayed in a heatmap in five different colours:
- Grey box: expression level is below cutoff (0.5 TPM or FPKM)
- Light blue box: expression level is low (between 0.5 to 10 TPM or FPKM)
- Medium blue box: expression level is medium (between 11 to 1000 TPM or FPKM)
- Dark blue box: expression level is high (more than 1000 TPM or FPKM)
- White box: there is no data available
Filter your results
By default, expression data for different tissues (that is the biological condition pre-selected) are displayed. However, you can use the filters in the left to explore UMOD gene expression in other biological conditions such as cell lines.
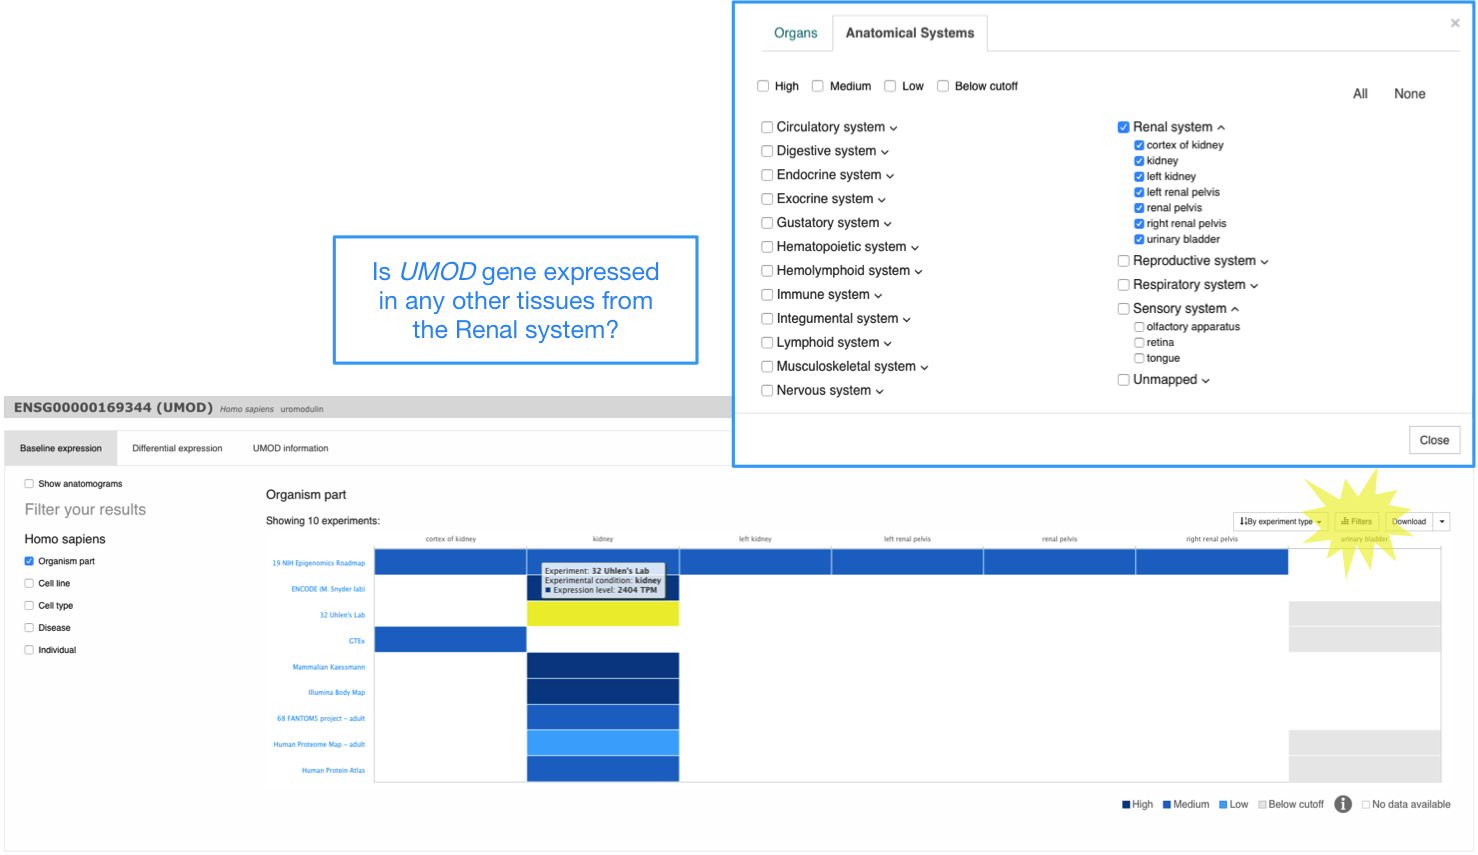
Anatomical Systems Filter
Use the Filters button above the heatmap to display gene expression in a particular anatomical system. For example, you can filter the results in the heatmap to show UMOD gene expression only in renal system.
Baseline experiment page
Each baseline experiment in Expression Atlas has its own Experiment page. Just click in the title of any experiment in the baseline expression results (e.g. Uhlen’s lab) to see the corresponding baseline experiment page. If you want to see gene expression results not only for UMOD gene, you have to remove it from the Genes box and click Apply.
In a baseline experiment page, expression levels are displayed in one heatmap by colour intensity, according to the gradient bar above the heatmap. The gradient shows intensities corresponding to expression levels for the 50 genes displayed. Mouse over a cell in the heatmap to see expression values for each gene in each tissue (or other condition).
Specify a minimum expression level
Use the Expression value box to specify a different minimum level (the default one is 0.5) so only genes expressed above this level are displayed.
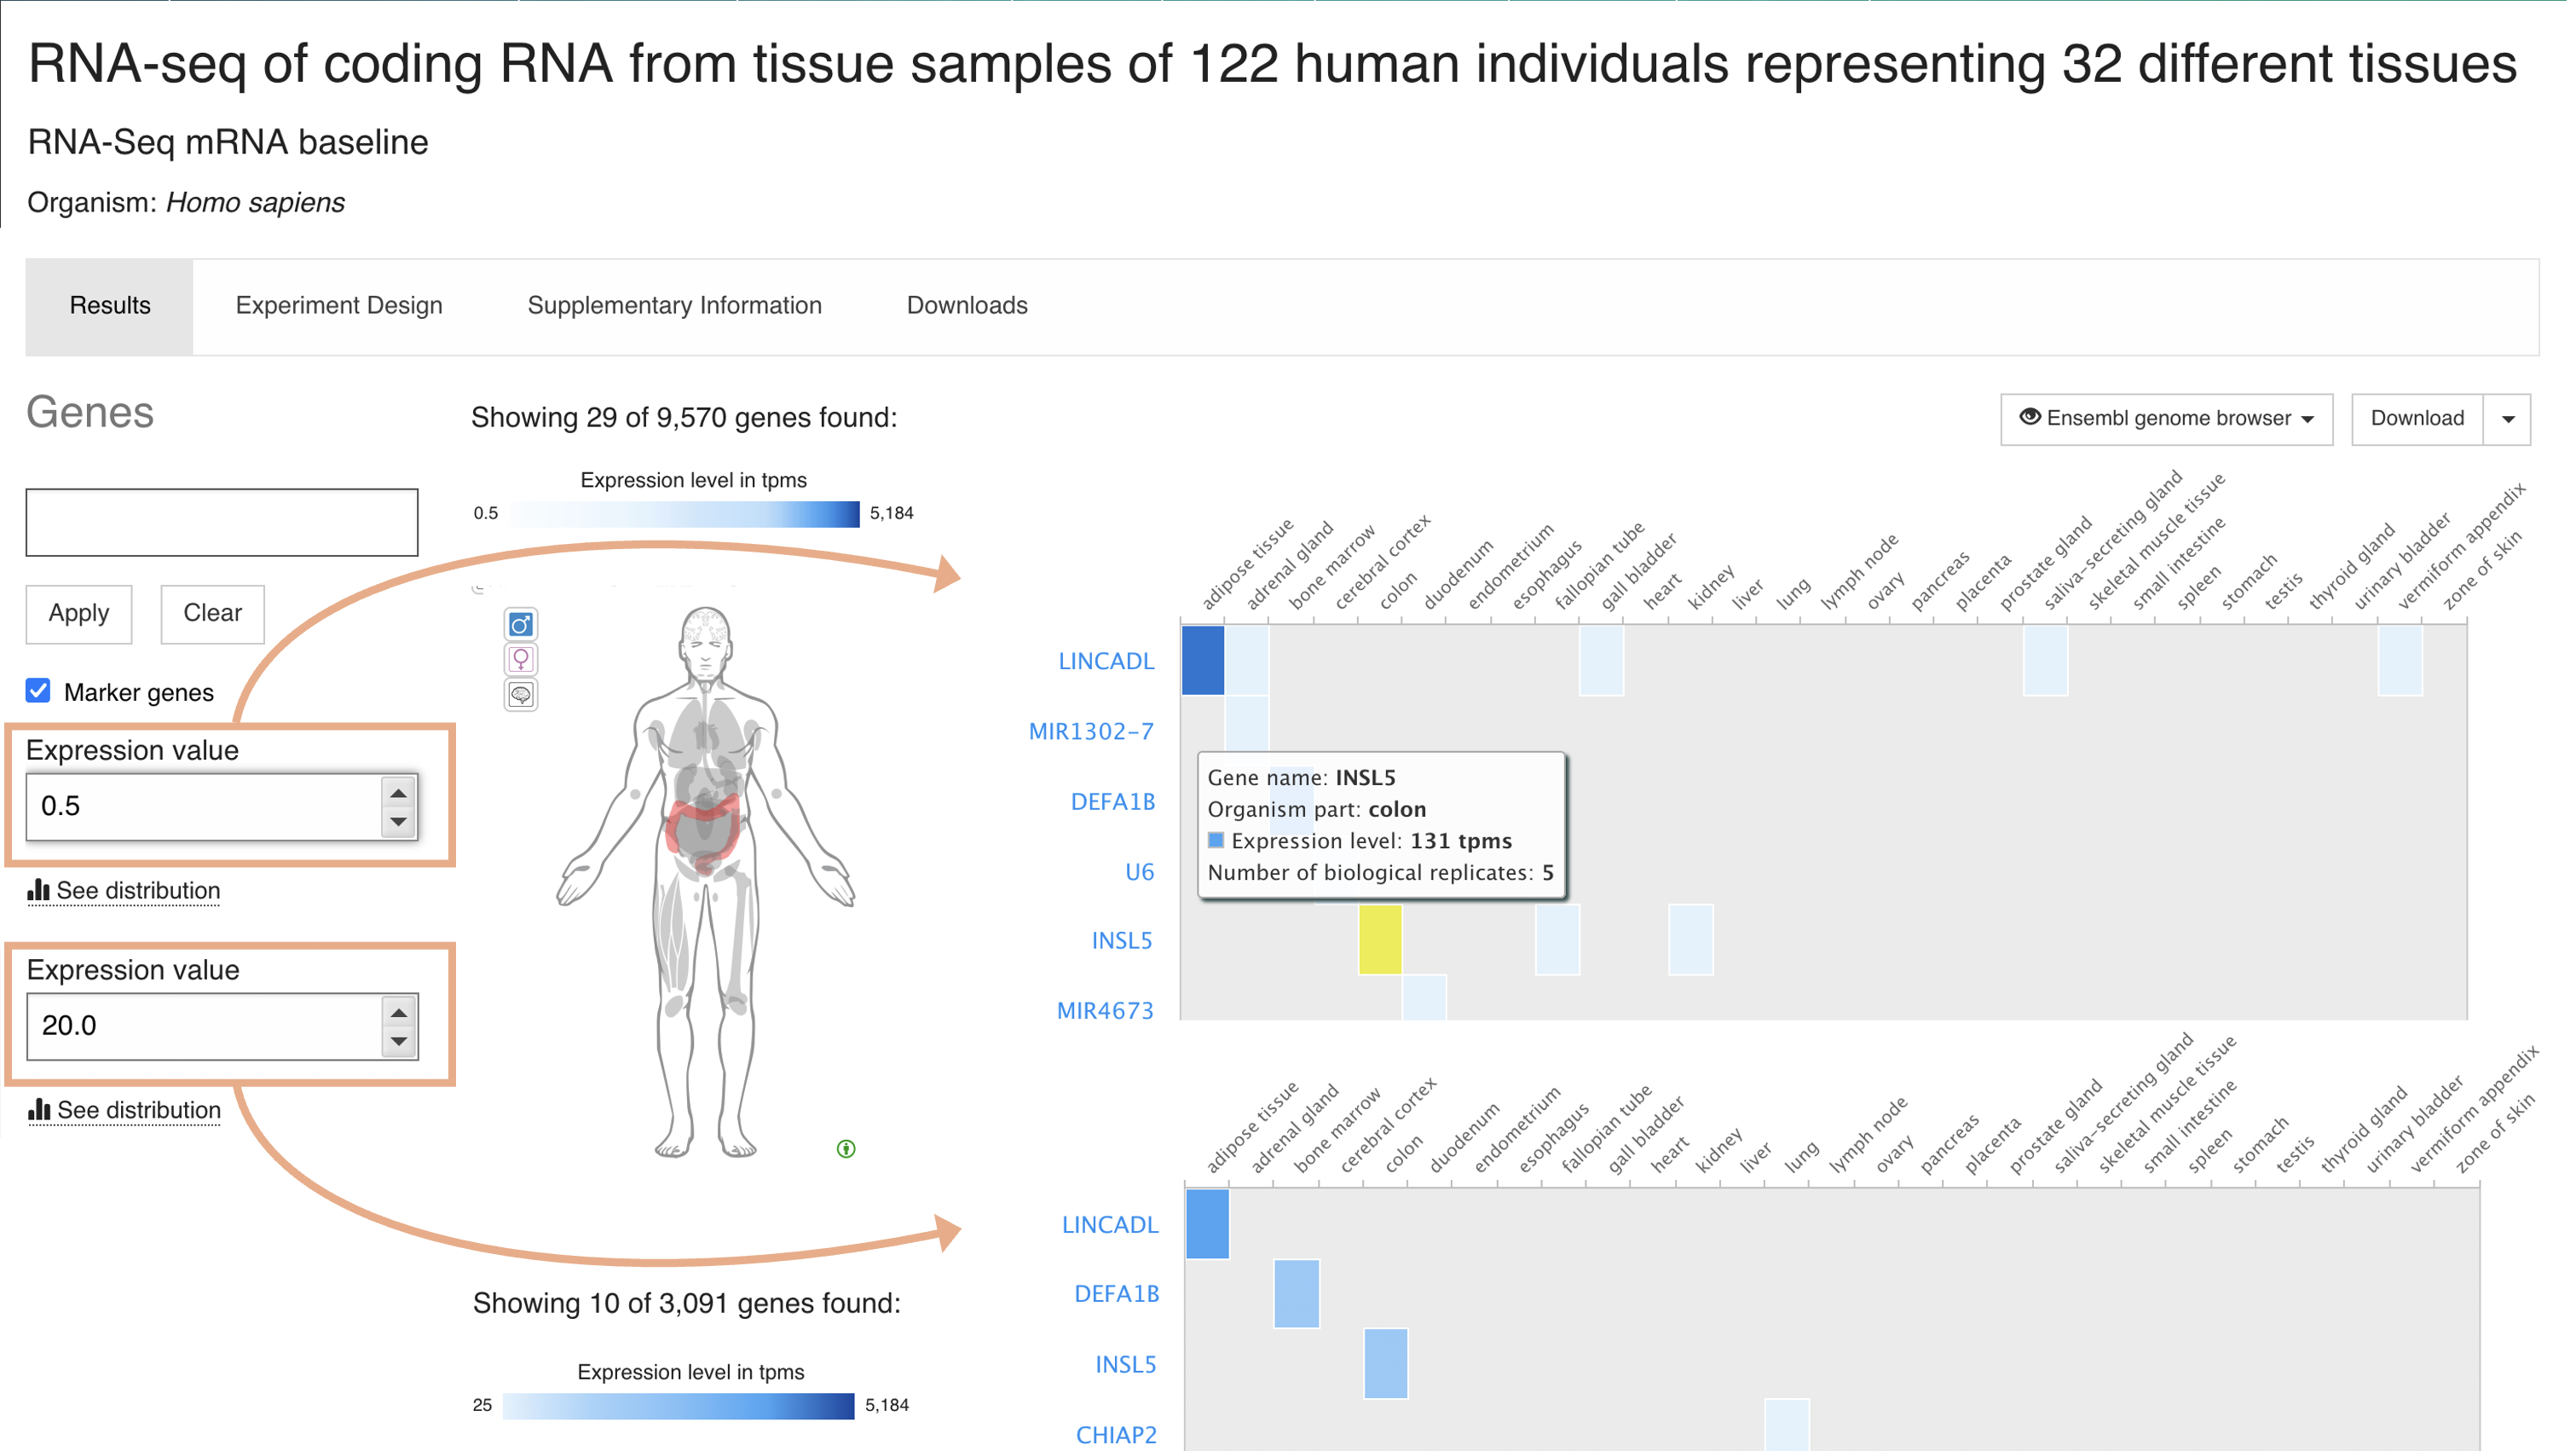
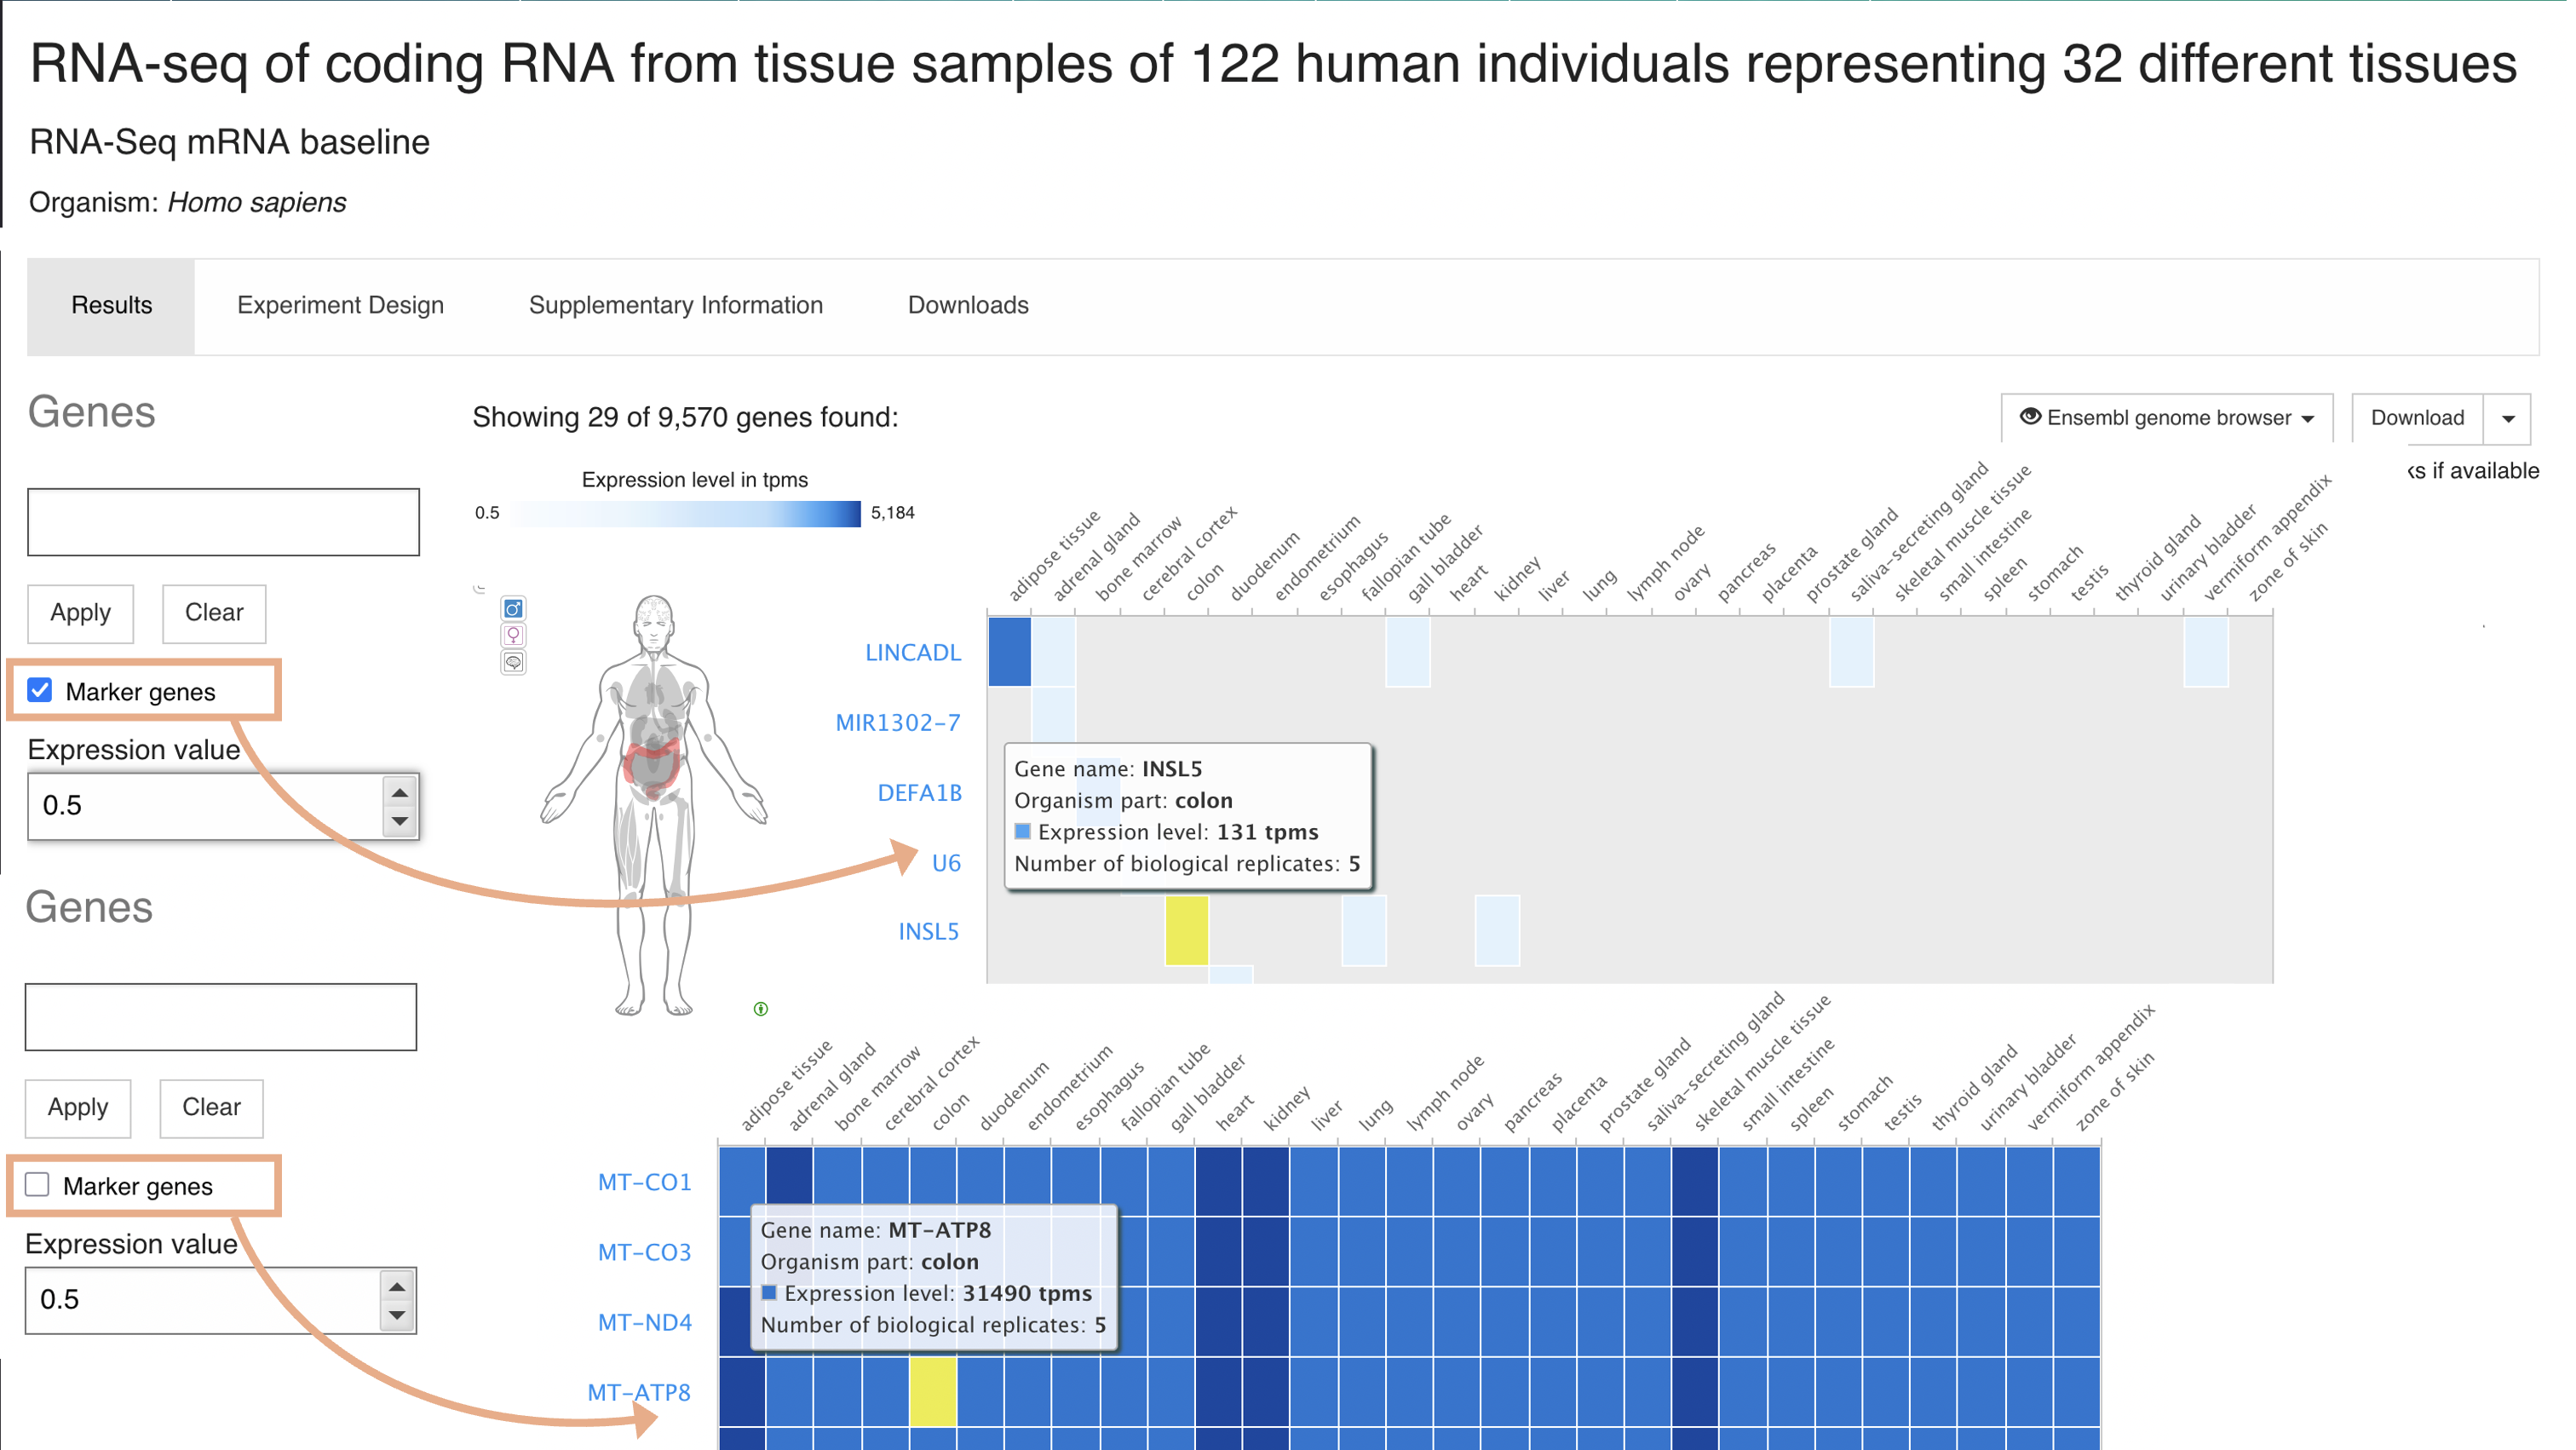
Marker genes search
By default, top 50 (or minimum one per condition) marker genes (rows) across all conditions (columns) studied in the experiment are displayed. Uncheck the Marker genes option to show genes with highest expression first.
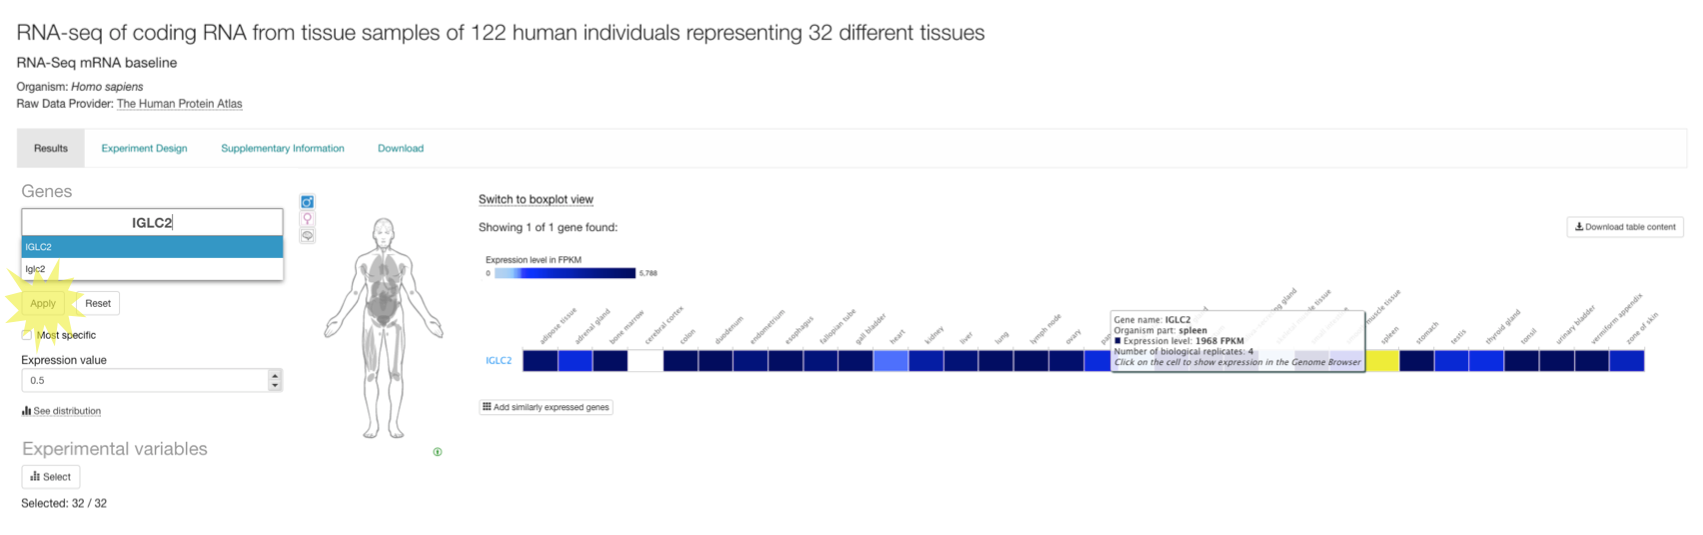
Searching with genes
Use the Genes search box to search for a particular gene. You can search with Ensembl gene symbols (e.g. IGLC2), Ensembl ID (e.g. ENSG00000211677), UniProt accessions (e.g. A0A075B6K9) or InterPro terms (e.g. Immunoglobulin C1-set).
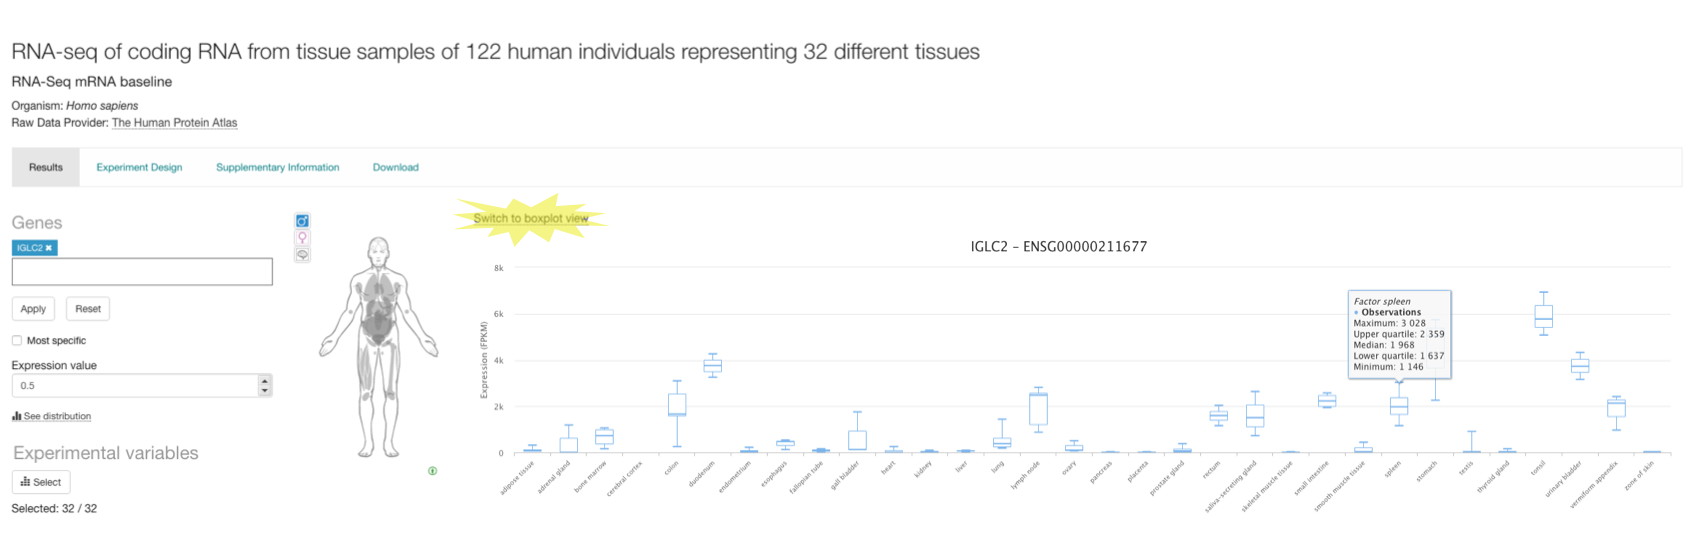
Visualise variation among biological replicates
When you search for a particular gene (e.g. IGLC2) in the baseline experiment page you have the option to see the variation of its expression among the biological replicates for each tissue (or other condition) in the experiment. Click on Switch to boxplot view to display a plot per tissue with the maximum, upper quartile, median, lower quartile and minimum expression values for each set of biological replicates.
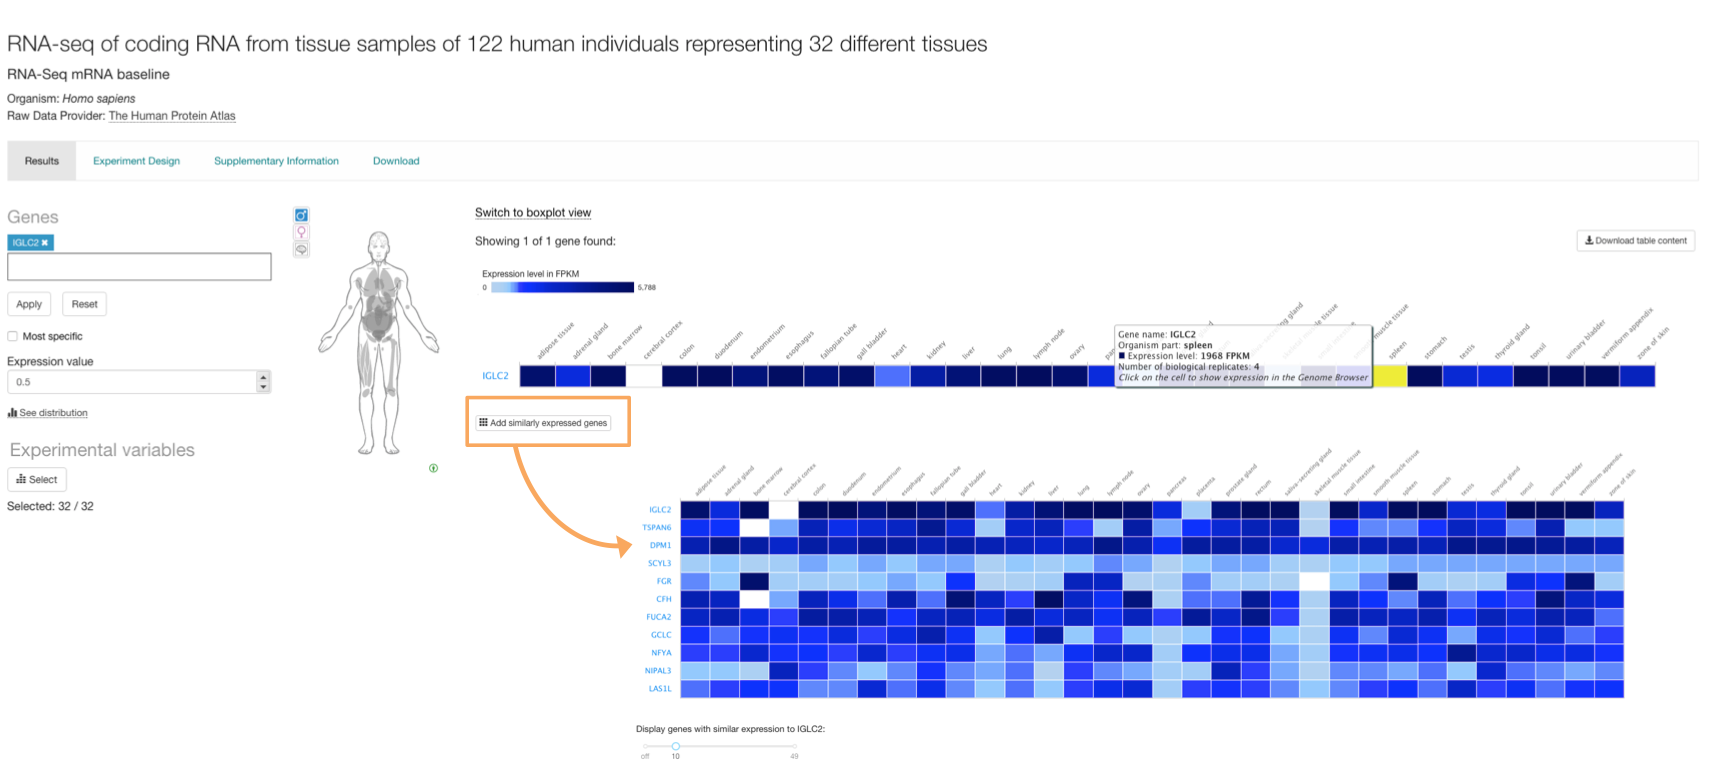
Similar expression
Click on Add similarly expressed genes button below the heatmap to explore gene co-expression across tissues (or other condition). A list of genes with similar expression pattern across tissues is shown. Adjust the number of genes displayed using the slider at the bottom.
Experiments with more than one experimental variable
There are baseline experiments with more than one experimental variable. For example, in experiment RNA-seq of long poly adenylated RNA and long non-poly adenylated RNA from ENCODE cell lines three different types of RNA were extracted from six cellular components in 23 human cell lines. However, only 18 cell lines are shown by default. If you click on the Select button below Experimental variables, you will see that the 18 cell lines displayed by default correspond to the ones satisfying the following criteria:
- Experimental variable ‘cellular component’ is whole cell
- Experimental variable ‘RNA’ is long polyA RNA
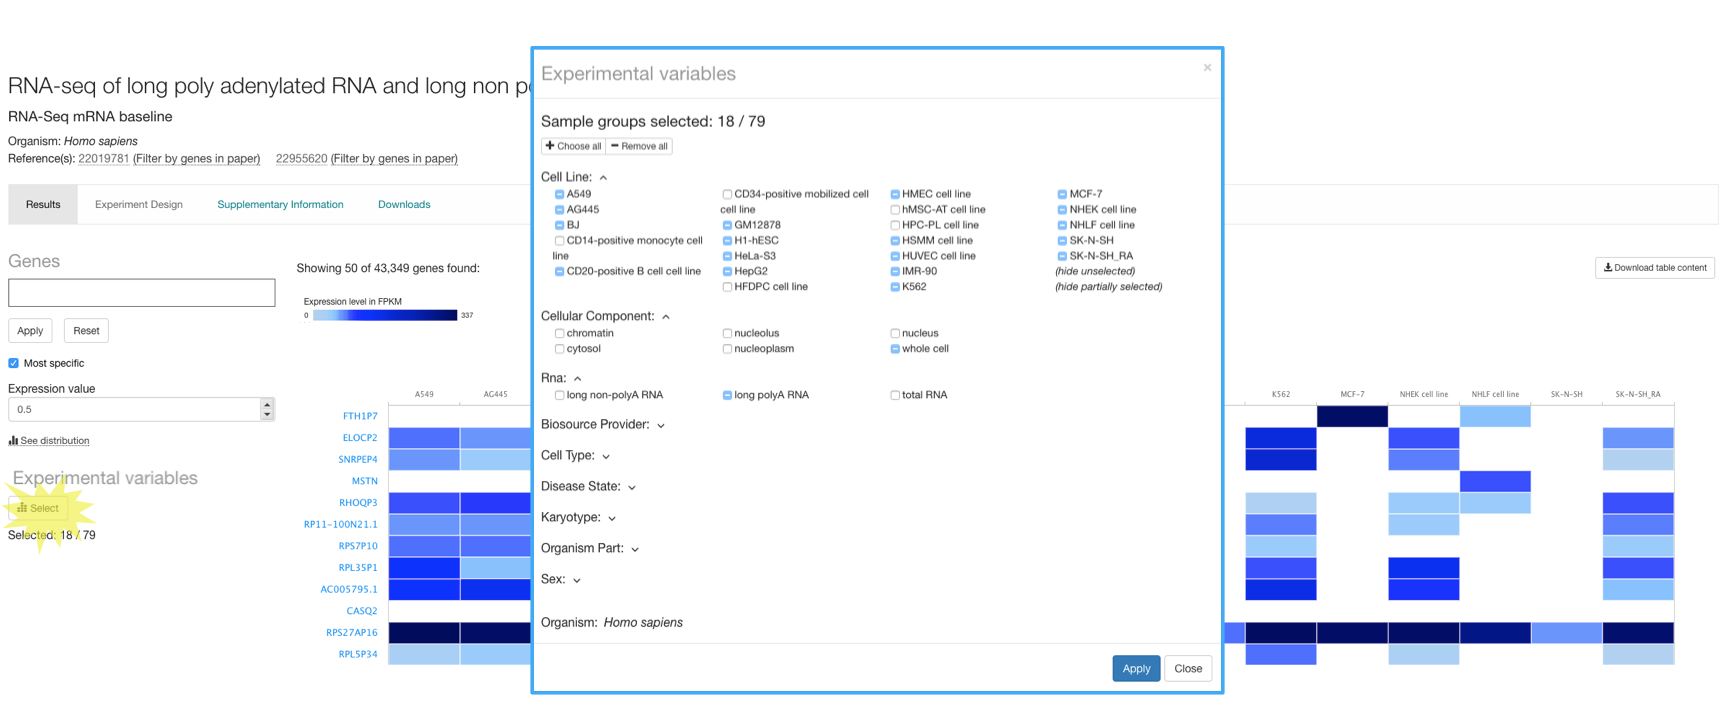
You can display the whole experiment just by clicking on the Choose all button in the top of the Select Experimental variables window.
Other information in the baseline experiment page
The Experiment Design tab shows RNA-seq processing run accessions (from ENA), along with their corresponding biological sample characteristics and experimental variables values.
The Supplementary Information tab includes Analysis Methods (list of the analysis methods we applied to the raw data in FASTQ format to obtain gene expression results) and Resources to see the experiment in ArrayExpress.
The Downloads tab contains all the files that you can download such as: i) gene expression results in tab-delimited format, ii) file containing the R object representing the experiment and iii) results of hierarchical clustering using the top 100 most variable genes across all tissues (or other condition) in the experiment.
Transcript quantification
As part of our colaboration with Gramene, for baseline plant experiments, you can also explore expression results at transcript level. From a plant baseline experiment page, such us this one studying gene expression of five different organs of wheat at three different developmental stages, you can search for a particular gene, e.g. TRIAE_CS42_1AL_TGACv1_000002_AA0000030 to display gene expression across all conditions studied.
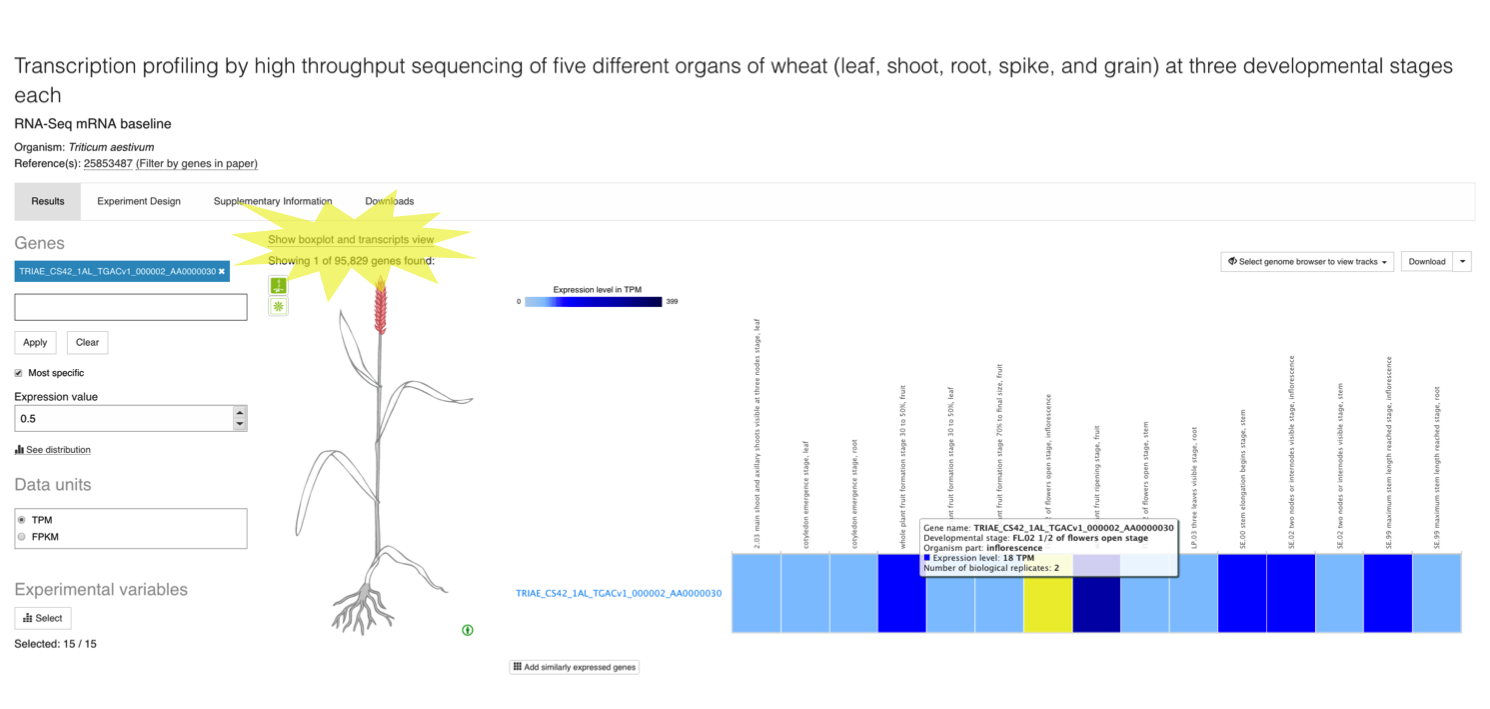
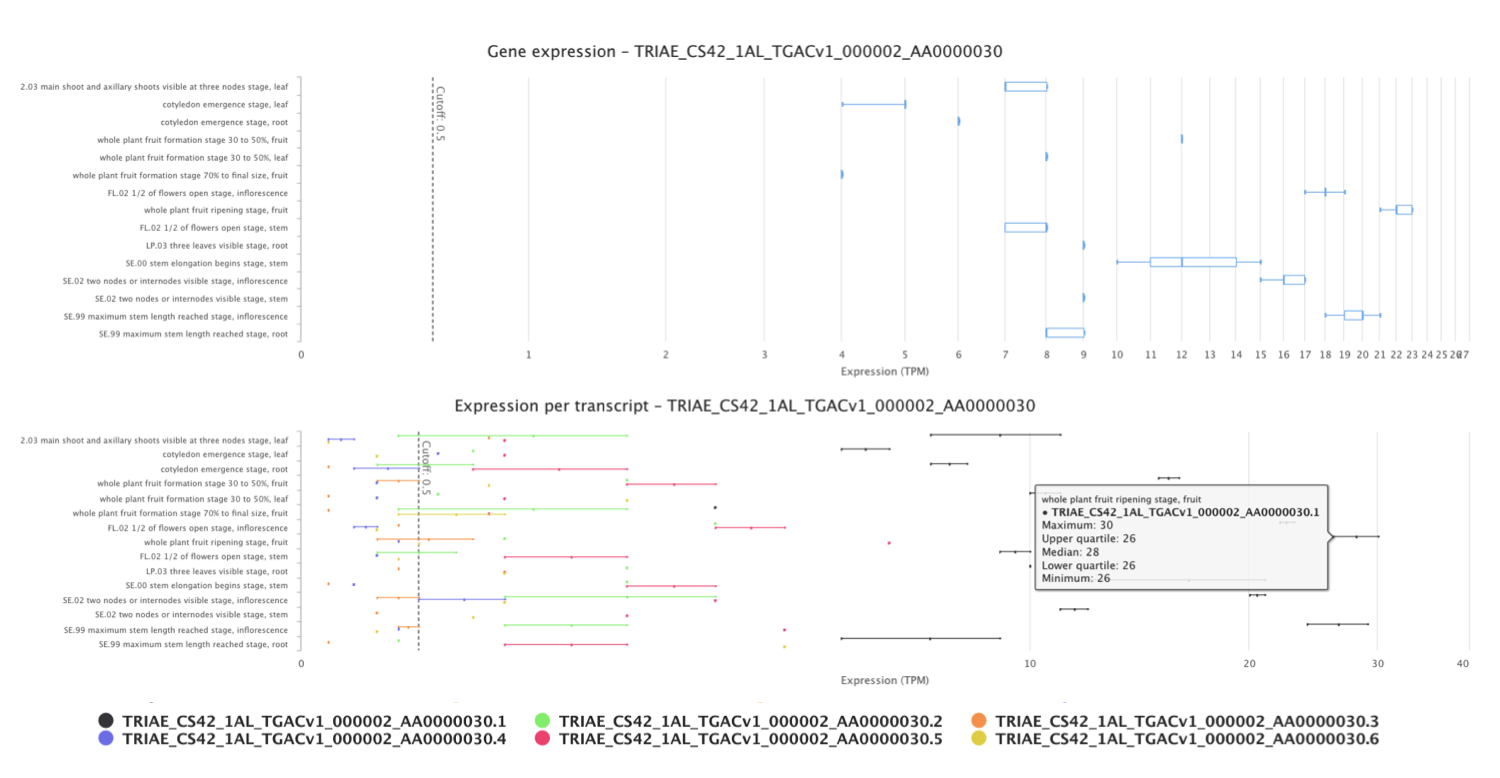
Click on Show boxplot and transcripts view to display expression levels of each of the six transcripts for TRIAE_CS42_1AL_TGACv1_000002_AA0000030 gene across the different conditions studied. Abundance of transcripts from RNA-seq data was quantified using kallisto.
Differential expression results
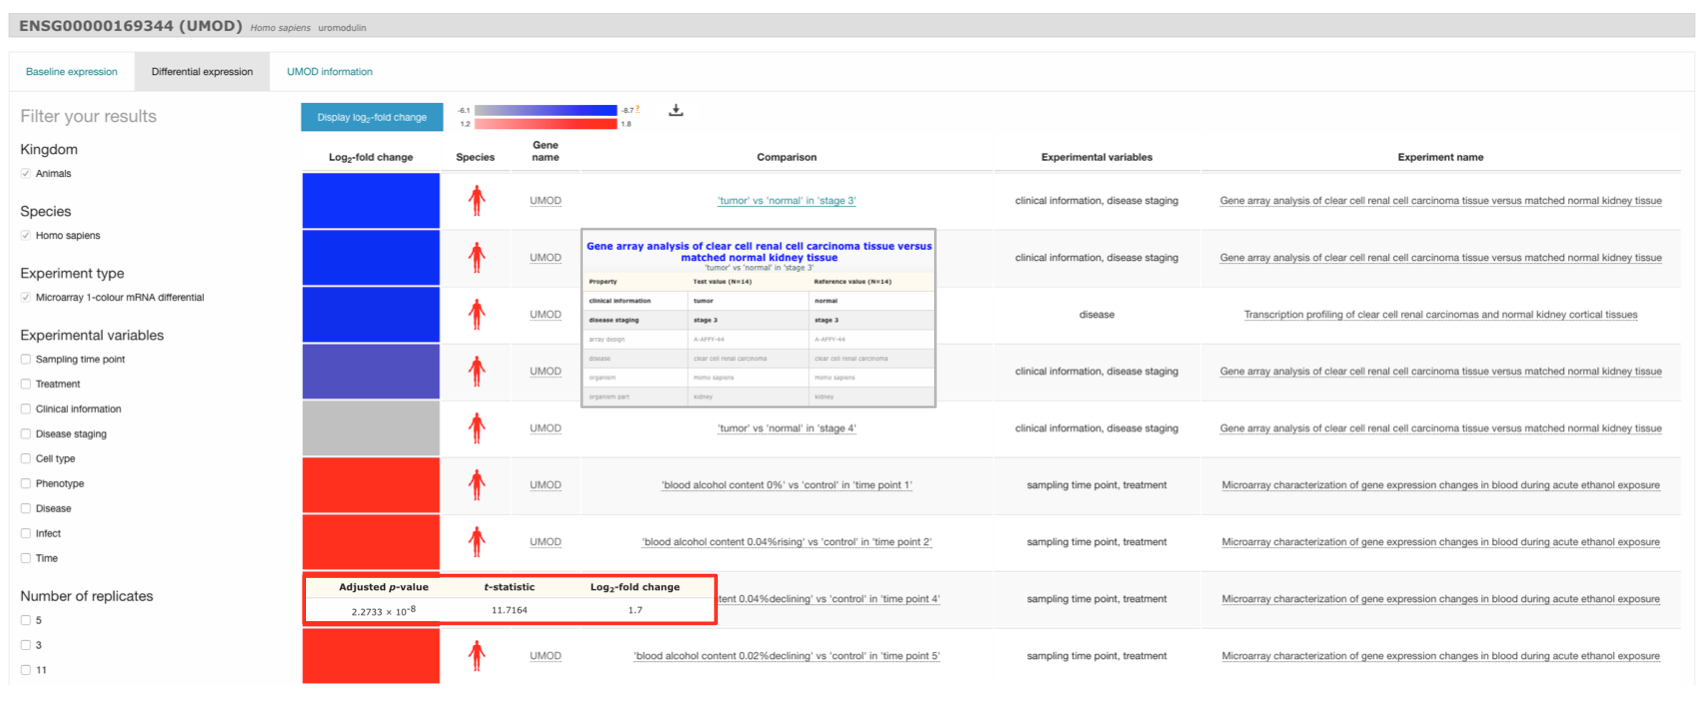
When you search for a particular gene (e.g. UMOD) in one species (e.g. Homo sapiens), the Differential expression results will show all comparisons in which UMOD gene is differentially expressed (absolute value of log2 fold-change > 1 and adjusted p-value < 0.05). Mouse over each colour boxed to see UMOD gene expression values in each particular comparison. Mouse over each comparison to display more information: experimental variables are shown in bold along with other characteristics that define each group of samples compared.
Filter your results
You can narrow down the results displayed by using the filters in the left to select, for example, only comparisons in which UMOD gene is up-regulated.
Differential experiment page
Each differential experiment in Expression Atlas has its own Experiment page. Just click in the title of any experiment in the differential expression results (e.g. Gene array analysis of clear cell renal cell carcinoma tissue versus matched normal kidney tissue) to see the corresponding differential experiment page.
In a differential experiment page, differentially expressed genes (rows) in each comparison studied (column) are displayed in one heatmap by colour intensity, according to the gradient bar above the heatmap. The gradient shows intensities corresponding to the top 50 differentially expressed genes displayed. In the case of microarray data, design elements are displayed alongside genes (rows).
The heatmap ranks genes by absolute log2 fold-change. Blue cells indicate the gene is down-regulated while red ones correspond to up-regulated genes. Mouse over a cell in the heatmap to see log2 fold-change and adjusted p-value (and t-statistic for microarray data) for differentially expressed gene in each comparison.
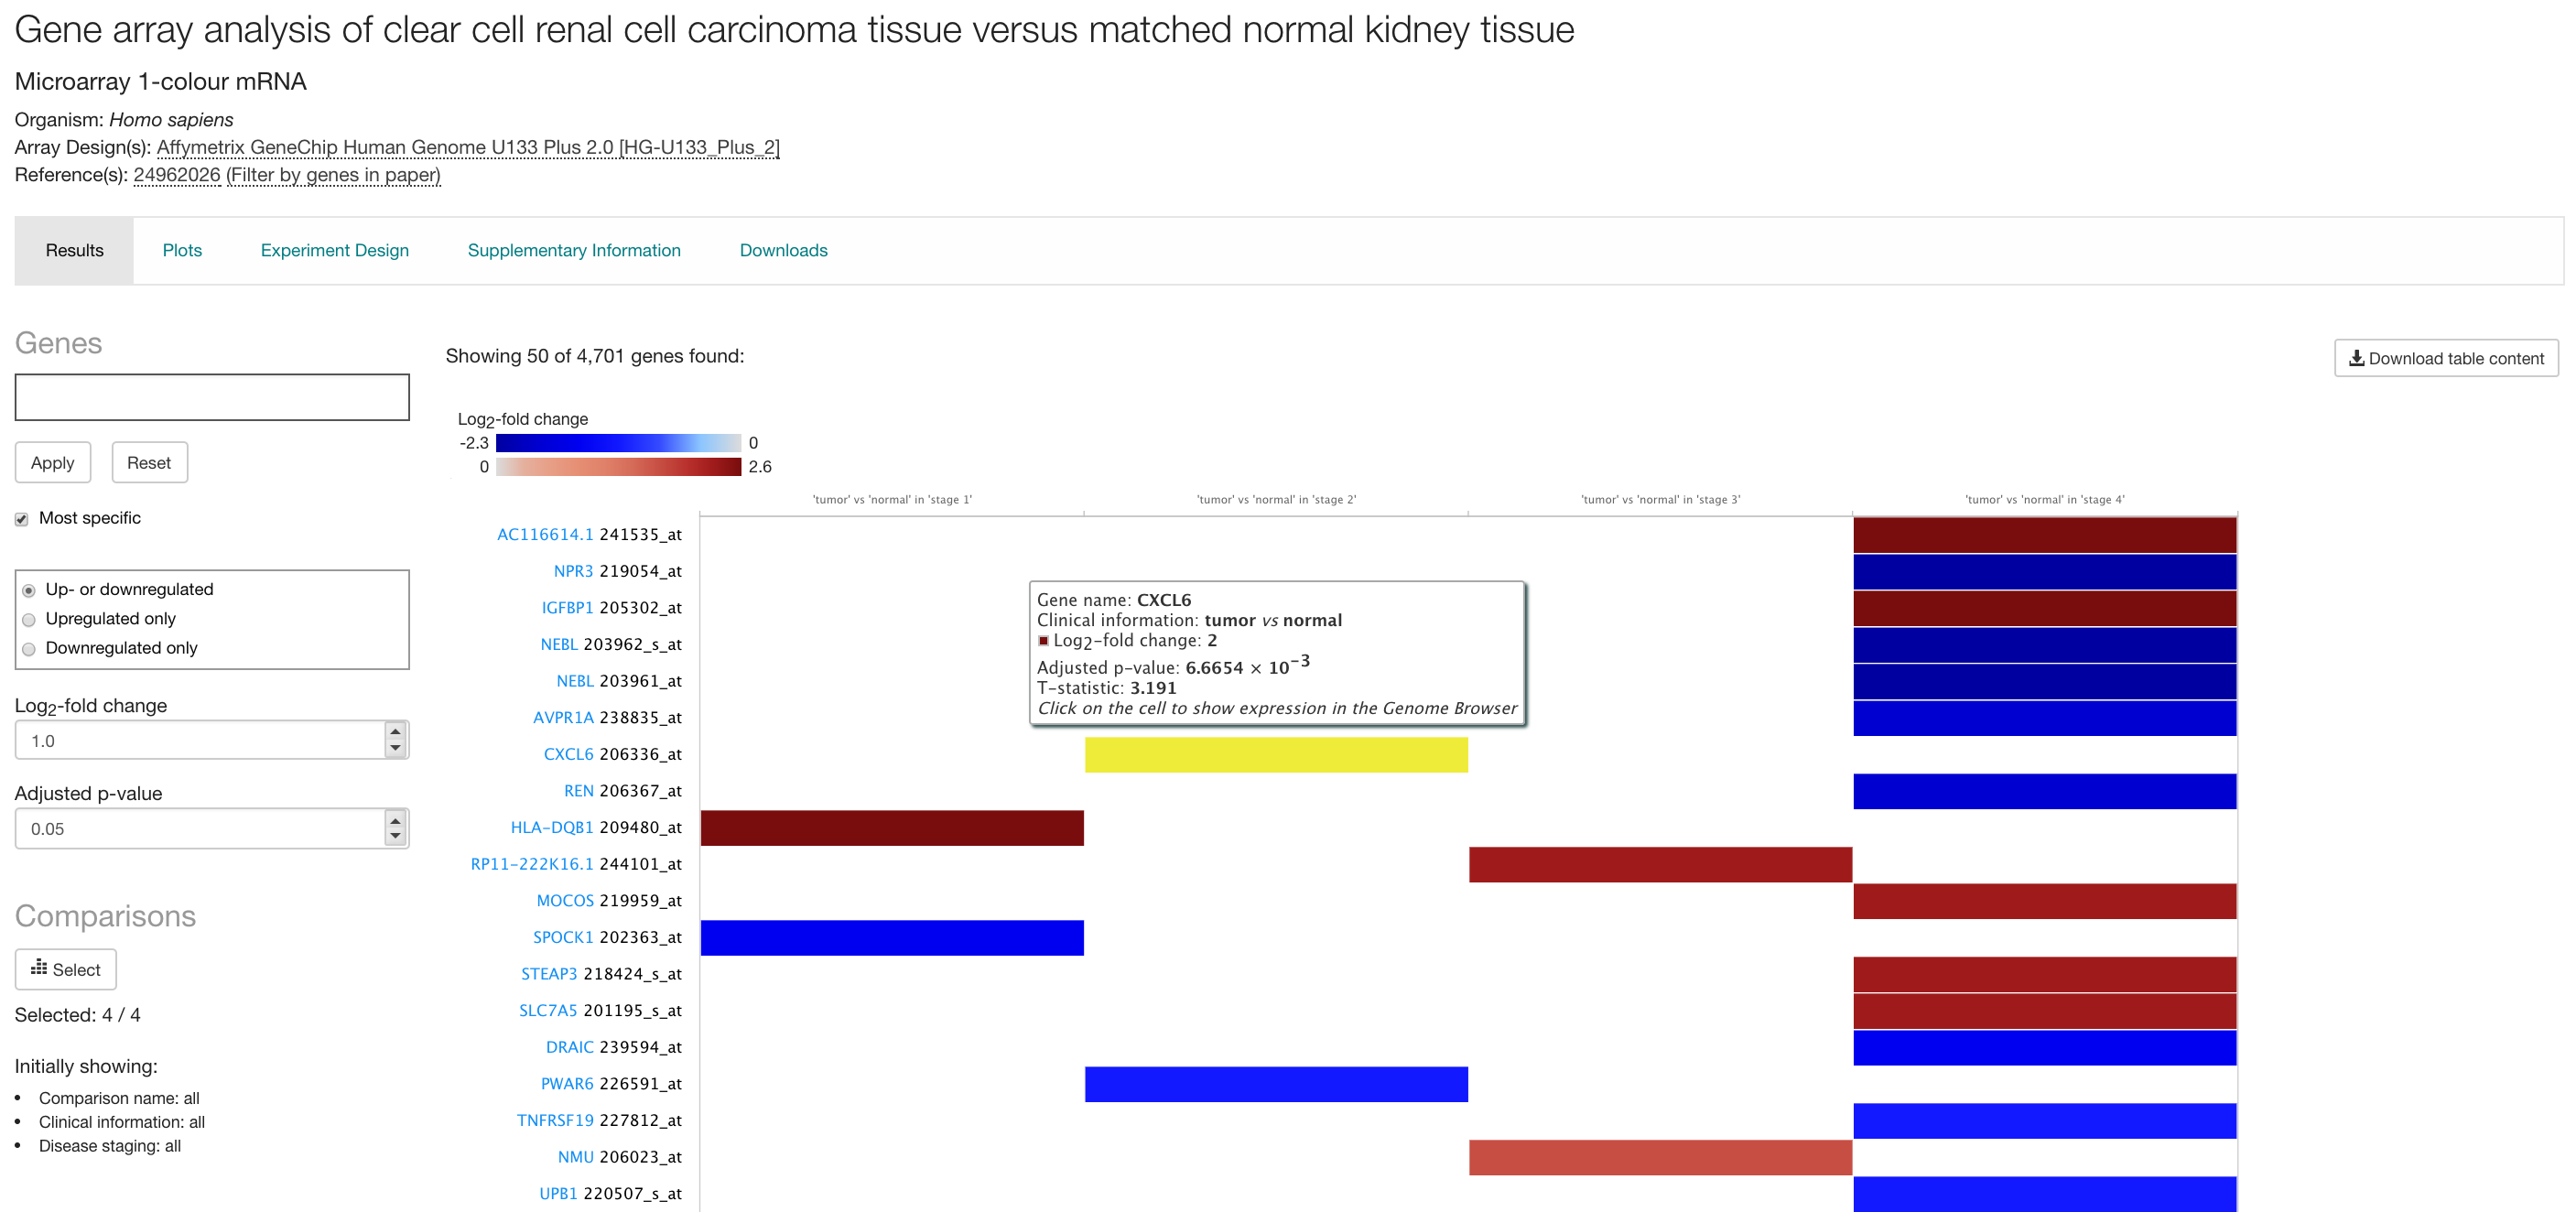
Specify different criteria for differential expression
Use the log2 fold-change and the adjusted p-value box to specify different criteria for differential expression (the default one is log2 fold-change > 1 and adjusted p-value < 0.05) so only genes satisfying both criteria are displayed.
Searching with genes
Use the Genes search box to search for a particular gene. You can search with Ensembl gene symbols (e.g. NEBL), Ensembl ID (e.g. ENSG00000078114), UniProt accessions (e.g. A0A0U1RRK0) or InterPro terms (e.g. Nebulin repeat).
On microarray experiments a gene can be represented by more than one design element, also known as probe or probe set. This is the oligonucleotide probe on the microarray that targets that gene.
Most specific search
By default, genes that are differentially expressed in just one comparison are displayed, followed by genes differentially expressed in two comparisons, then three and so on, reporting genes that are differentially expressed in all comparisons at the end of the results. Unclick the Most specific option to show genes with largest absolute log2 fold-change in all comparisons first.
Select comparisons
Use the Select button below Comparisons to display gene expression results for specific comparisons that are more relevant to you.
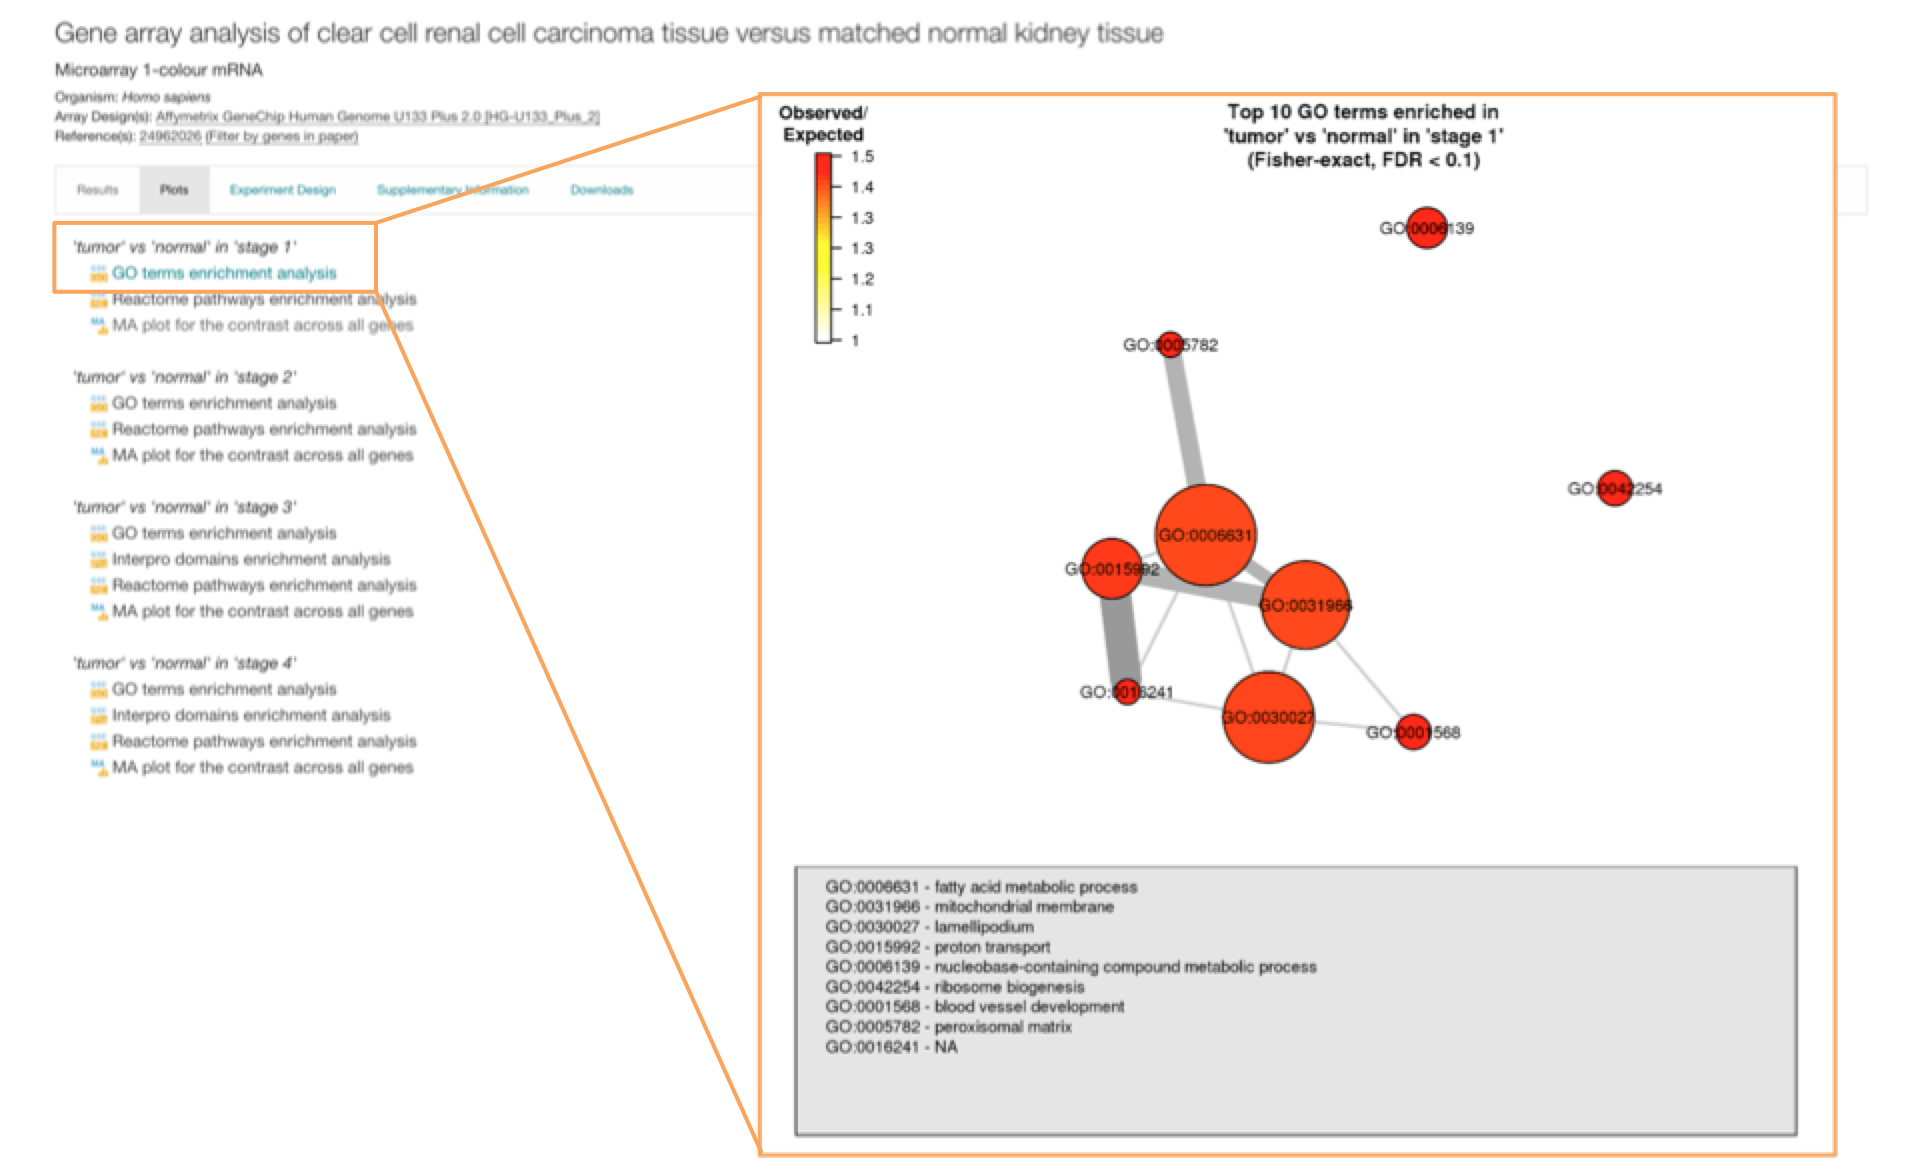
MA plots and enrichment analysis
The differential experiment page shows an additional tab called Plots. Two types of plots can be visualised:
- MA plot for each comparison. This plot displays the average expression level for each gene (normalized microarray intensity level or RNA-Seq log2 counts-per-million) on the x-axis against log2 fold-change on the y-axis. Differentially expressed genes at FDR < 0.05 are shown in red in the plot.
- Enrichment analysis plots to see if there is any Gene Ontology, InterPro or Reactome term significantly over-represented in the set of differentially expressed genes.
Enrichment analysis is performed using the Piano package from Bioconductor. For each comparison, enrichment between the set of differentially expressed genes and terms from GO, InterPro and Reactome is performed, using Fisher’s exact test with multiple testing correction (FDR < 0.1). Enrichment analysis plots are available only when statistically significant enrichment of terms was detected. Click on one plot to display it.
The plot corresponding to GO terms enrichment analysis shows a maximum of 10 enriched terms (nodes) from a list sorted by the effect size (i.e. the number of observed divided by the number of expected genes annotated with a given term within the differentially expressed set of genes). The terms are linked by edges representing genes shared between them - the more genes shared between the two terms, the thicker the edge. The size of each node represents the proportion of differentially expressed genes annotated with each term.
Other information in the differential experiment page
The Experiment Design tab shows RNA-seq processing run accessions (from ENA) or microarray assay accessions, along with their corresponding biological sample characteristics and experimental variables values.
The Supplementary Information tab includes:
- Analysis Methods to see the list of the analysis methods we applied to the raw data to obtain differential expression results.
- Resources to see the experiment in ArrayExpress.
- QC report to see the results of quality assessment for the experiment data files. For microarray experiments, this report is generated by the arrayQualityMetrics package from Bioconductor in R. Briefly, outlier arrays are detected using distance measures, box plots, and MA plots. Any array that is found to be an outlier by all three of these methods is excluded from further analysis. For RNA-seq experiments, the QC report is generated by the iRAP pipeline.
The Downloads tab contains all the files that you can download such as: i) RNA-seq raw counts or normalised microarray intensity data, ii) all statistical analytics results for all comparisons in the experiment, iii) file containing the R object representing the experiment.